
In recruiting, location has always mattered. This year’s Recruitment Marketing Benchmark Report shows just how dramatically geography influences apply rates, costs, and overall efficiency.
If you’re planning budgets, forecasting recruiting bottlenecks, or deciding where to prioritize investment, here’s what you need to know.
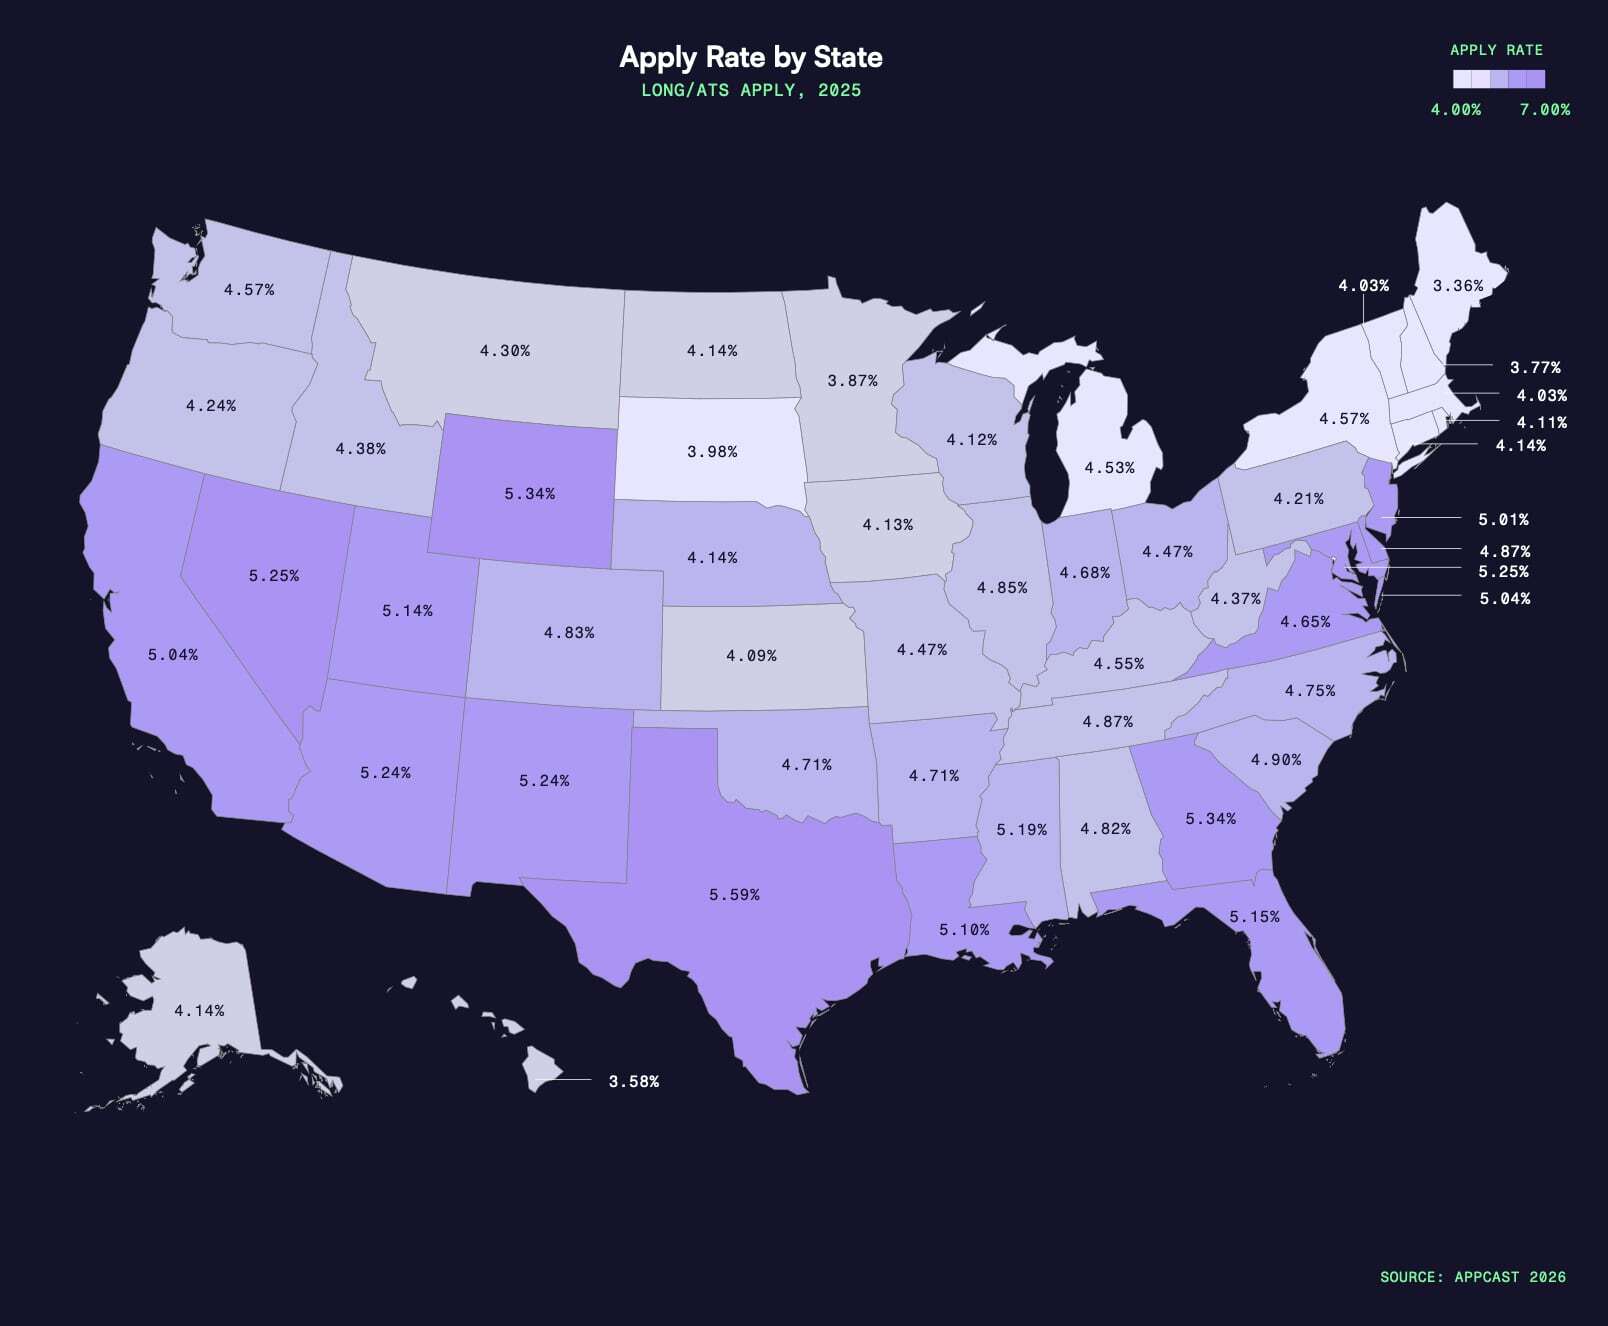
Younger, faster‑growing states deliver higher apply rates
Apply volume follows people. States with younger populations and high in‑migration consistently deliver the strongest apply rates. Many of these fast‑growth states cluster across the Sun Belt, where a steady influx of workers adds both talent supply and economic momentum.
Take California vs. Vermont.
- California: Unemployment at 5.0% → Apply rate 5.0%
- Vermont: Unemployment at 2.6% → Apply rate 3.4%
The takeaway is simple: More available workers generate more applications, which directly drives down cost-per-application (CPA).
But this pattern isn’t uniform. Wyoming, for example, bucks the trend with low unemployment but strong apply rates — proof that local labor conditions aren’t one‑note. Regional industry mixes, wages, migration patterns, and even culture can affect candidate behavior.
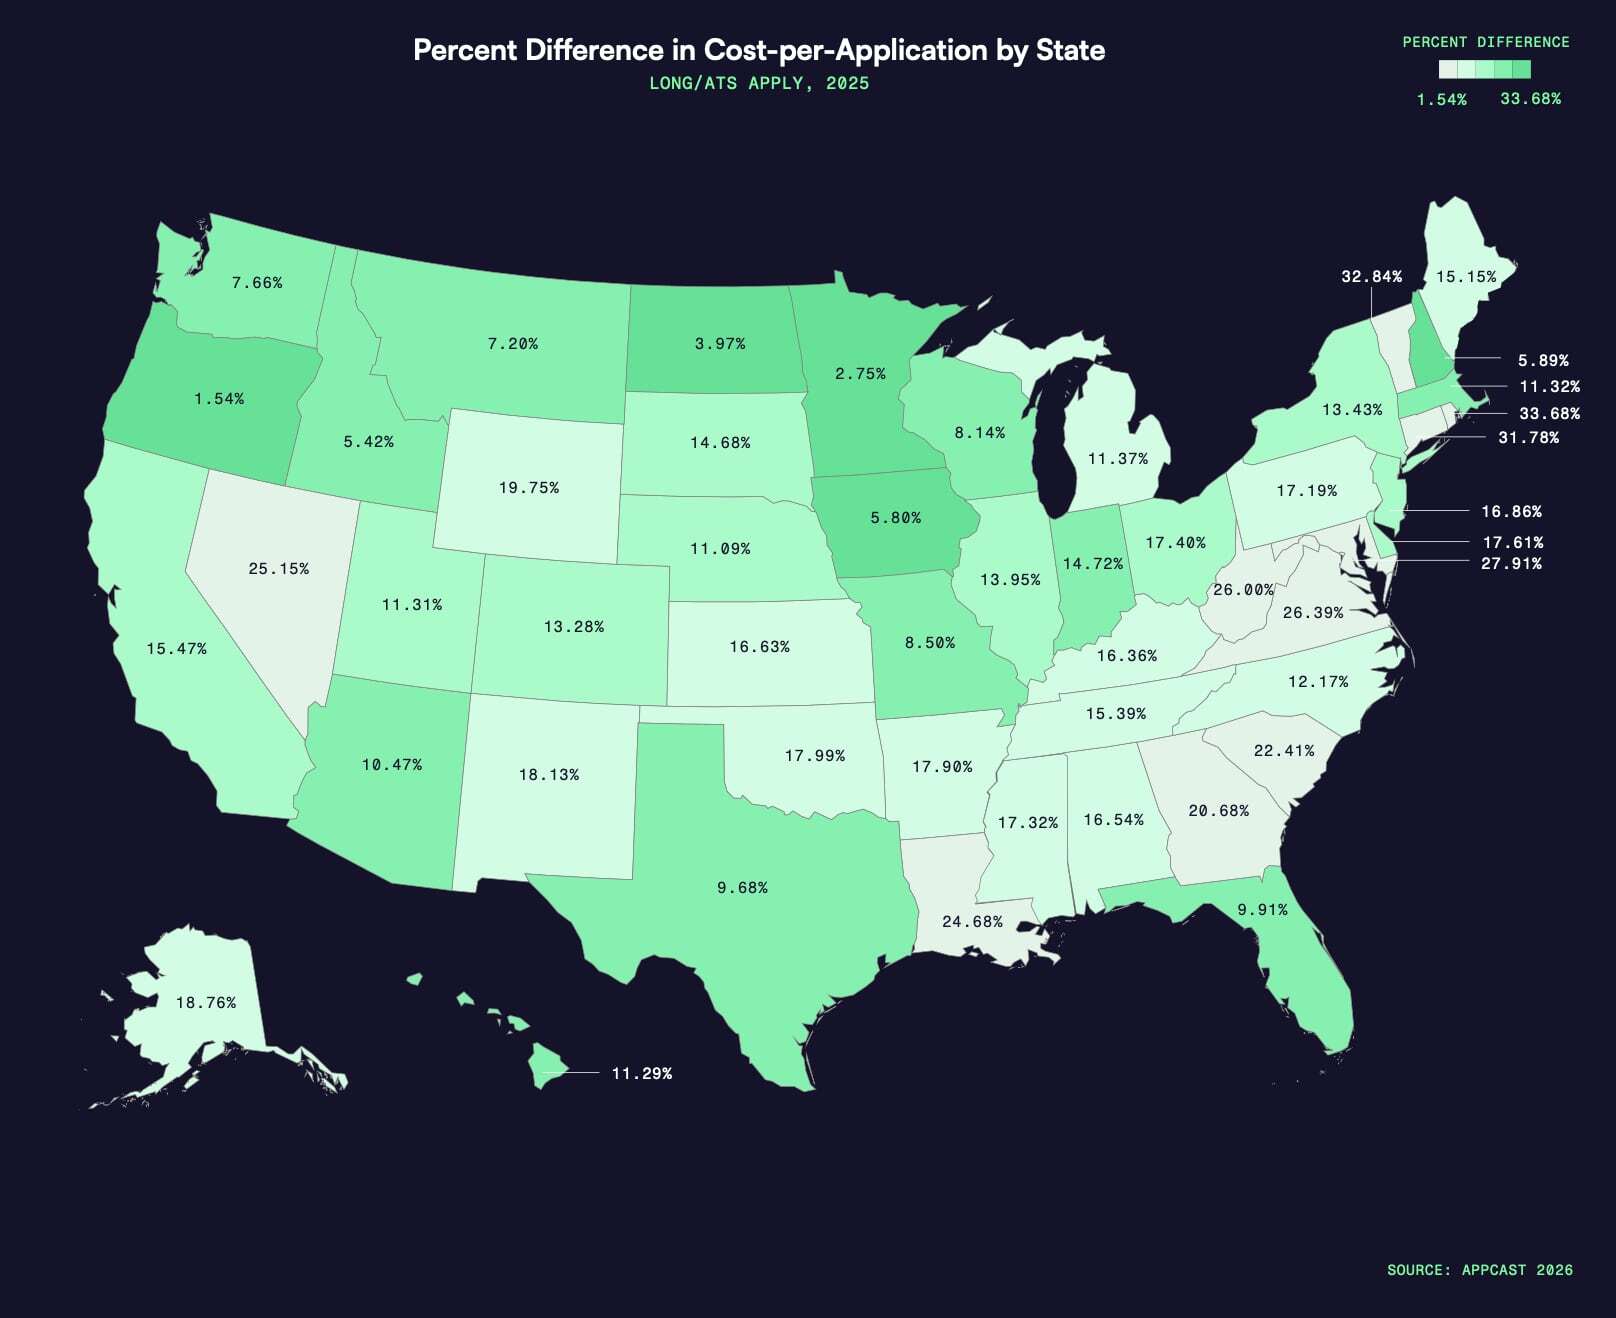
Older, more rural states have the highest CPAs
On the other end of the spectrum, markets with older workforces remain some of the hardest and most expensive places to hire as fewer active job seekers lead to higher CPAs.
The data reinforces a rule many TA leaders know intuitively: low apply rates and high CPAs travel together.
But here’s what’s changing…
The Southeast is no longer the bargain it used to be
Traditionally, the Southeast offered some of the lowest CPAs in the country, but not anymore. Growth in North Carolina, South Carolina, Georgia, and surrounding states has brought booming business activity and steep competition for talent.
For high‑volume employers, this shift is important. If your hiring strategy still counts on the Southeast to deliver “cheap” applications, it may be time to revisit your assumptions.
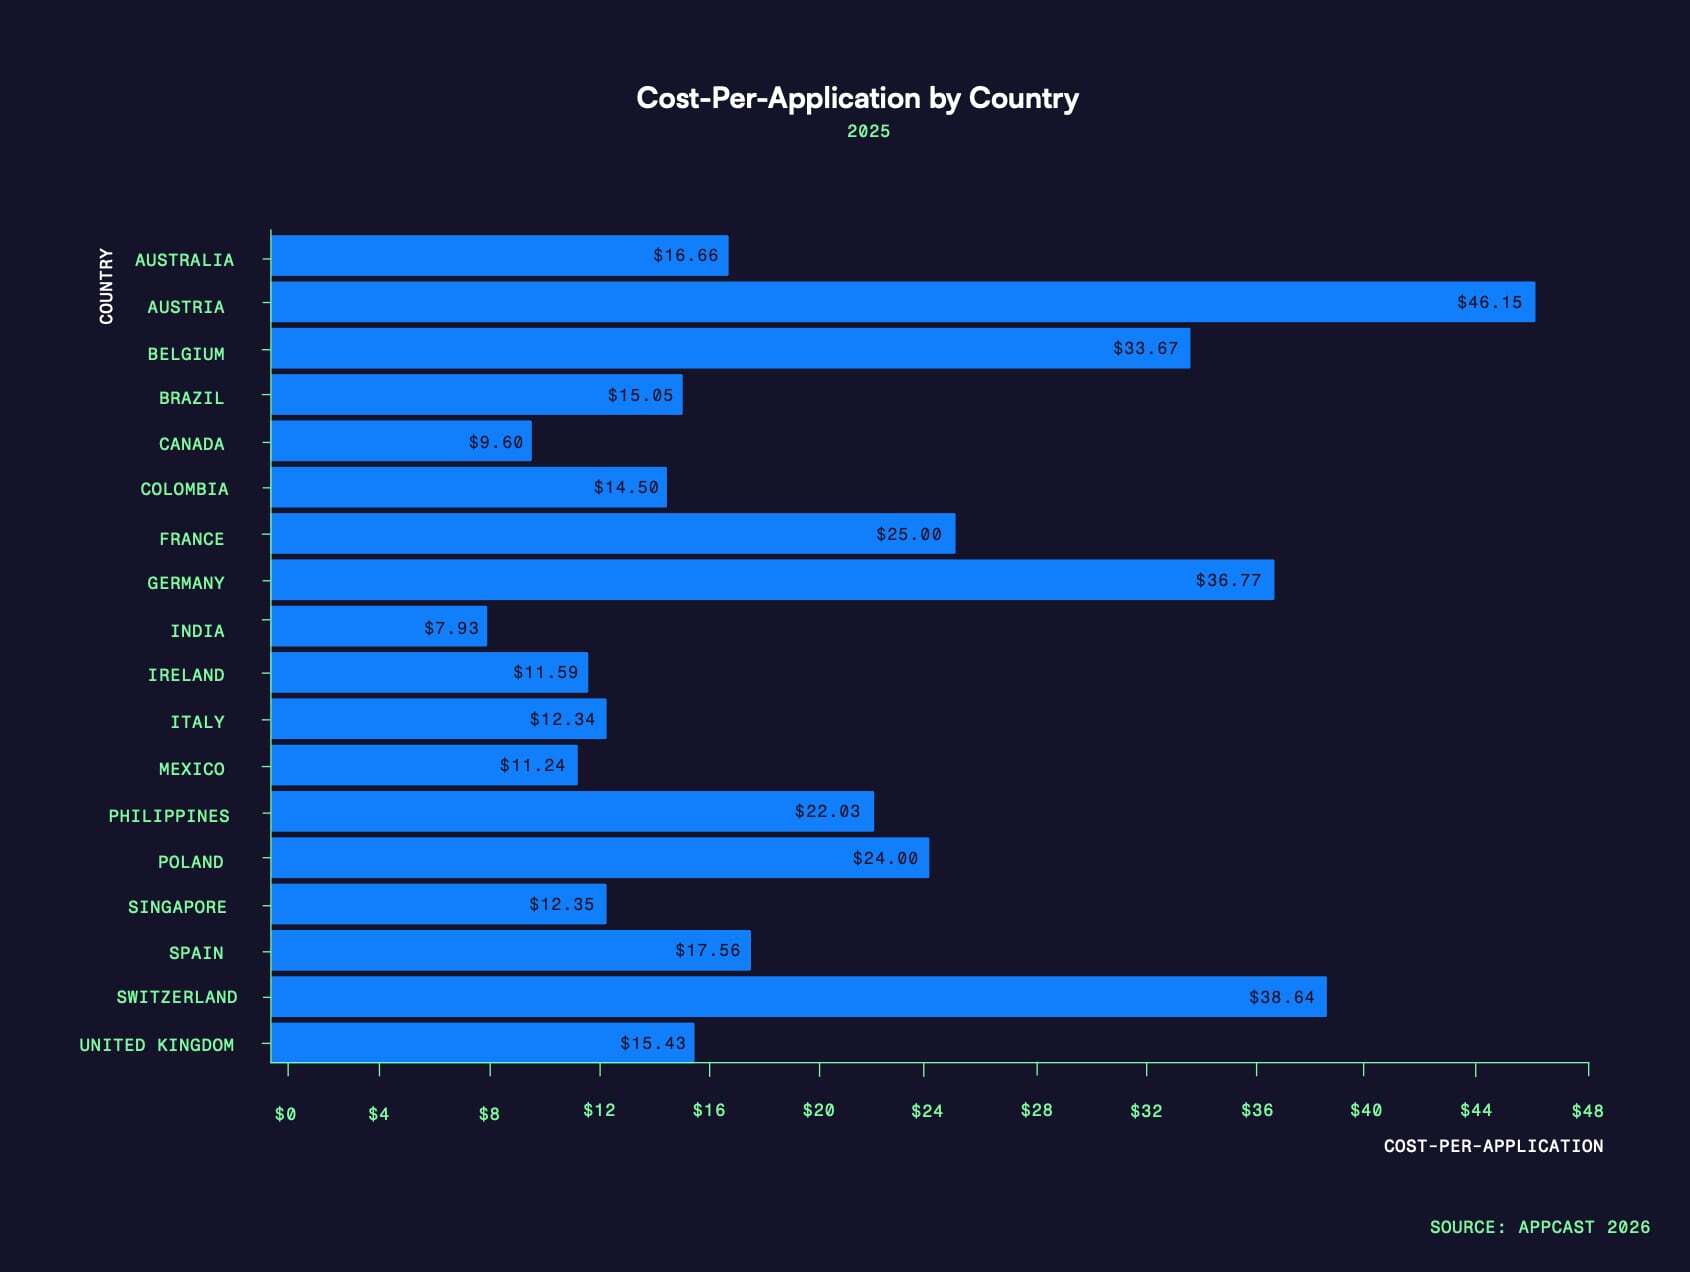
The U.S. and Europe are diverging
One of this year’s biggest updates: international benchmarks.
While U.S. hiring costs continue to climb, CPAs in many European markets are falling. A cooling U.K. labor market, for example, is creating more candidate supply and easing employer costs.
For global or expanding organizations, these differences matter. They impact budget planning, media strategy, and expectations for hiring velocity.
What this means for your 2026 recruiting strategy
1. Budget by location, not just role
A healthcare job in Texas won’t cost what it costs in Maine. A customer service role in Georgia won’t perform like one in Ohio. For many teams, location is a bigger cost driver than the job itself.
2. Re-evaluate your “easy” hiring markets
If you’ve historically relied on the Southeast for high‑volume hiring, monitor your CPAs closely. Costs are rising faster than in other regions.
3. Use apply‑rate patterns to predict recruiting bottlenecks
Young, growing markets will continue to deliver higher apply rates, but they also attract more employers. Treat these markets as competitive, not guaranteed.
To learn more, download our complete 2026 Recruitment Marketing Benchmark Report now.