
This year’s Benchmark Report includes one of the most meaningful additions in a decade: candidate disposition data. For TA leaders used to optimizing around cost-per-click (CPC), cost-per-application (CPA), and apply rate, this down‑funnel visibility is a game‑changer.
Here’s what disposition data is, why it matters, and how it reshapes the way you evaluate your recruitment investments.
What disposition data measures
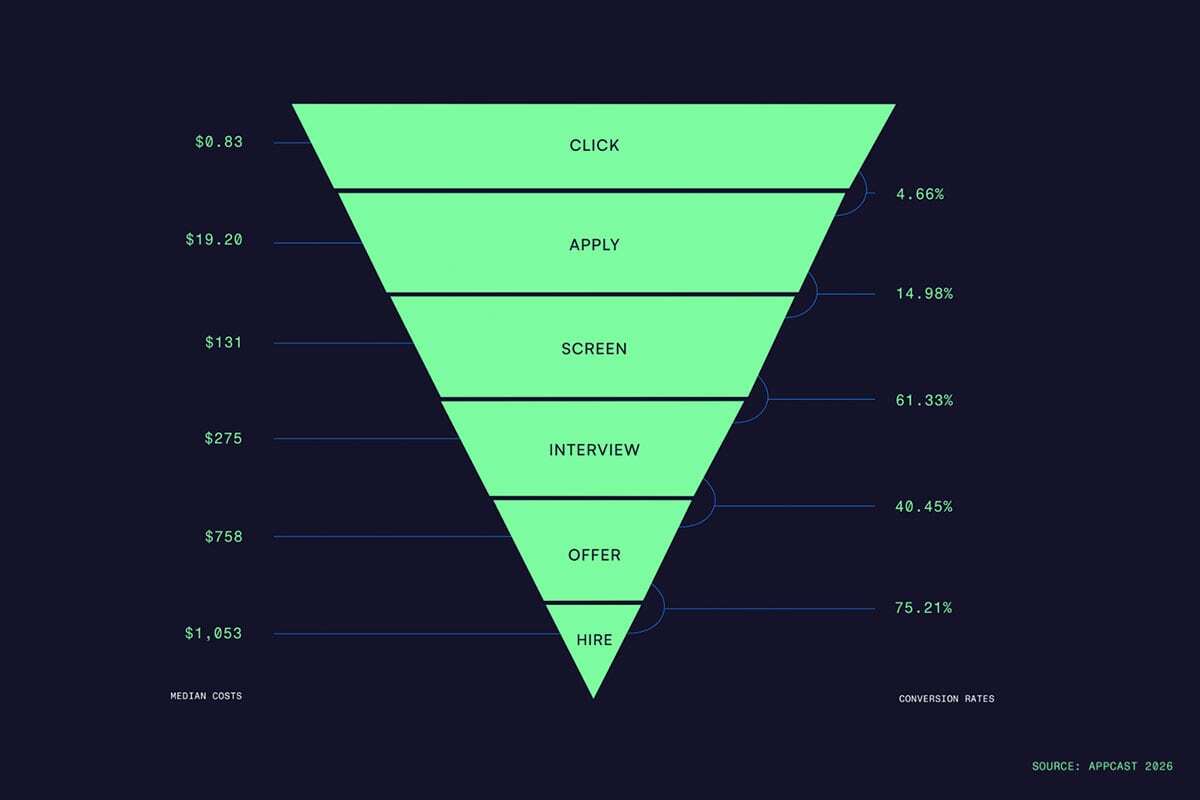
Disposition data tracks how candidates progress through standardized hiring stages:
- Applied
- Reviewed
- Screened
- Interviewed
- Offered
- Hired
It transforms data into a consistent, comparable view of funnel health. For the first time, employers can benchmark not just who applies, but who moves forward.
Why this matters for your hiring strategy
Top‑of‑funnel metrics are helpful, but they can’t tell you whether candidates were qualified.
A channel with a “high” CPA may perform better if its candidates sail through screening and interviews. A “cheap” source may become expensive once recruiter time, interview bandwidth, and decision cycles are considered.
Disposition data gives you what other metrics can’t: true cost efficiency.
The data highlights how specialized roles drive higher screening costs
Science and engineering, healthcare, tech, and finance all show the highest median cost‑per‑screen. These roles demand specific qualifications or credentials, and the labor supply for many of them is thin.
The trend reveals two insights:
- Some industries get overwhelmed with unqualified applicants.
- Others get too few, requiring more investment to surface qualified talent.
Disposition data makes these patterns visible and actionable.
Disposition data varies sharply by occupation
Across all roles, the median cost‑per‑interview is $275, but the spread is wide. If your cost-per-interview sits far above the benchmark for similar occupations, you may be paying for high-volume but low‑quality traffic.
Cost‑per‑offer and cost‑per‑hire uncover bottlenecks that get missed when teams focus only on CPAs. For example:
- A low cost-per-offer but high cost-per-hire could signal compensation misalignment or offer‑acceptance problems.
- A high cost-per-application but low cost-per-offer might indicate that your applicants are extremely qualified — even if fewer apply.
Down‑funnel metrics connect efficiency to outcomes.
How TA teams should use disposition data in 2026
1. Measure quality, not just volume
Smart teams will shift their optimization from “How many applicants did we get?” to “How many qualified candidates moved forward?”
2. Compare sources by down‑funnel performance
Disposition data exposes channels with inflated CPAs and low interview yield — and highlights channels that consistently produce hireable talent.
3. Use disposition benchmarks to guide your media mix
Job boards may drive top‑of‑funnel volume. Search and social may drive higher‑quality candidates. Disposition data shows you the right blend.
4. Forecast recruiter workload accurately
High apply rates can actually slow down teams. Disposition metrics help model staffing needs and prevent funnel congestion.
5. Align TA and finance on the same KPIs
Cost-per-hire (CPH) reflects the true business cost of hiring. Disposition data makes that number predictable.