
What the Data Reveals
Over the past year, the UK labour market was hit by job losses and rising unemployment, creating a larger job-seeker pool, higher apply rates and decreased recruitment costs. This blog offers a snapshot of key findings from Appcast’s 2026 UK Recruitment Marketing Benchmark Report, and what they mean for employers today.
Labour Market Insights
From 2024 to the start of 2026, the UK unemployment rate increased, expanding the active job-seeker pool. This means that more candidates are now competing for fewer roles.
Current data shows that hiring is starting to level out, and an economic recovery may happen by the end of the year. However, higher oil prices could slow things down and raise the risk of a stagnant economy.
Another economic factor that is influencing the labor market is the minimum wage increases. Minimum wage now stands at 66% of the national median wage. Higher employment costs have led to less hiring, especially in retail, hospitality, and care, where wage costs are the hardest to manage. Because of this, youth unemployment has risen to 16%, the highest level since 2015. In 2026, policy support is expected to be limited, as wages and inflation are still growing at high levels.
Recruitment Marketing Benchmarks
To better understand how costs and conversion rates vary across the recruitment funnel, Appcast’s latest U.K. Recruitment Marketing Benchmark Report now features new candidate disposition data. This data includes cost-per-screen, cost –per-interview, and cost-per -ire, along with other conversion metrics, providing a clearer view of the full hiring process.
Cost –per-hire varies by industry, but one pattern is consistent. A high number of applicants without efficient screening and conversion can drive up overall hiring costs.
Occupational Group Insights
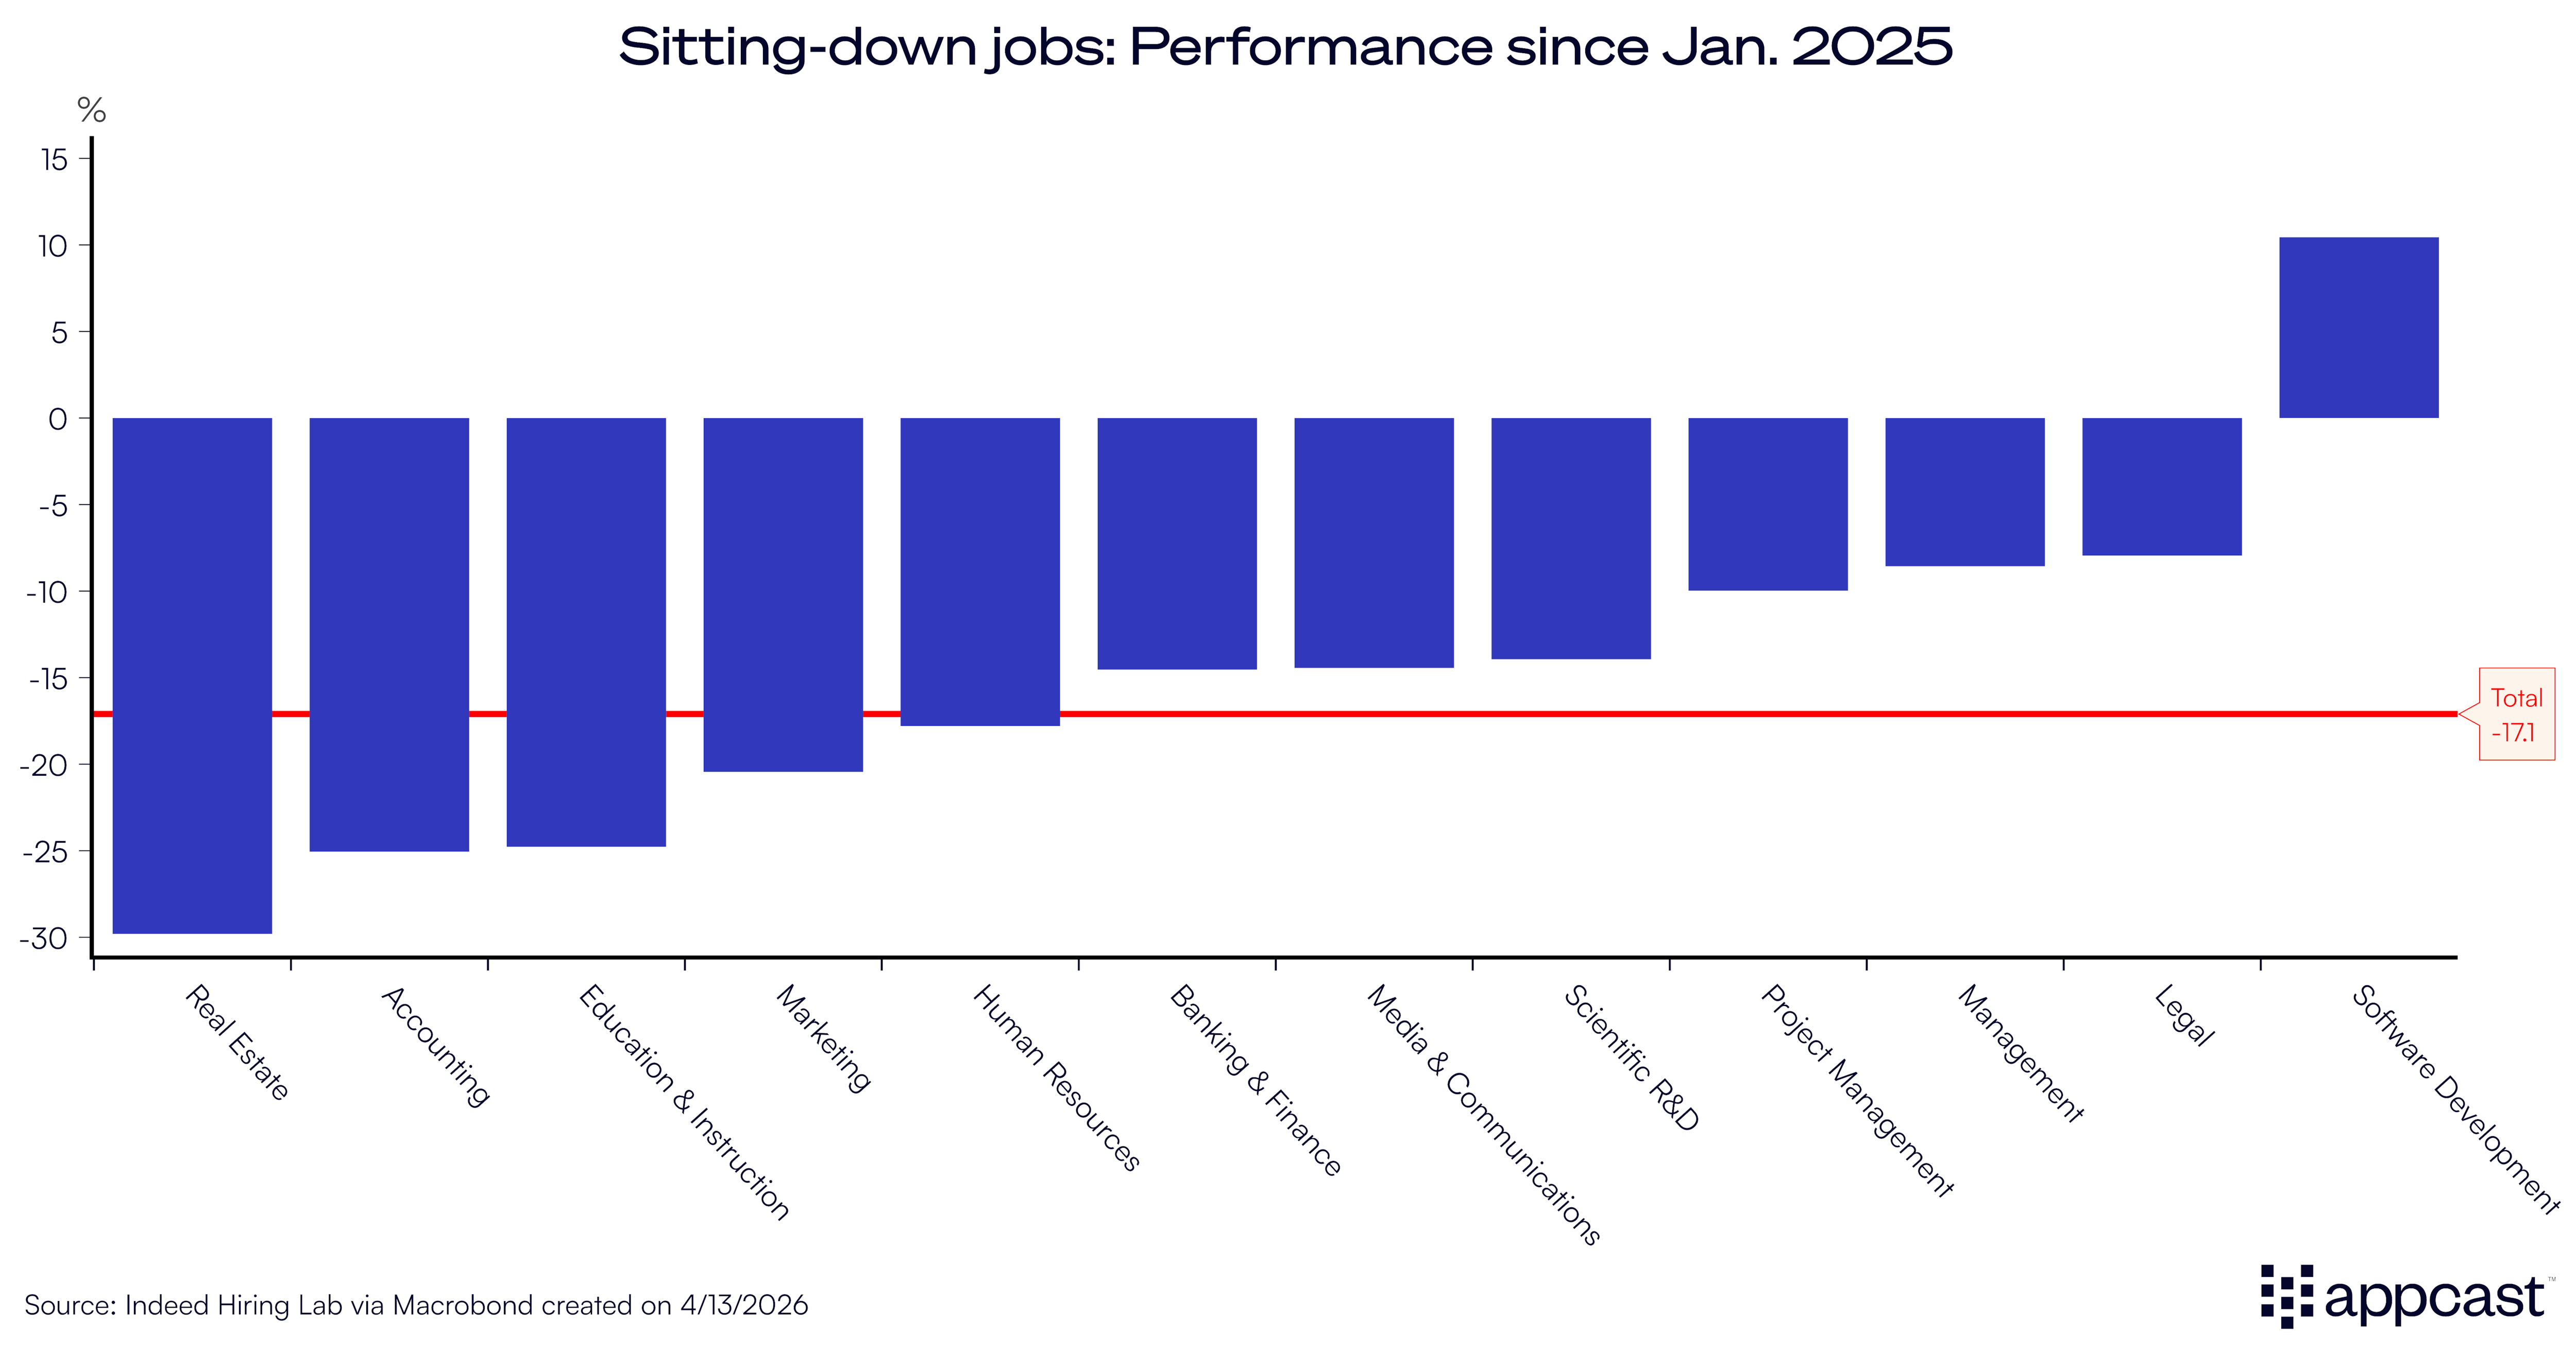
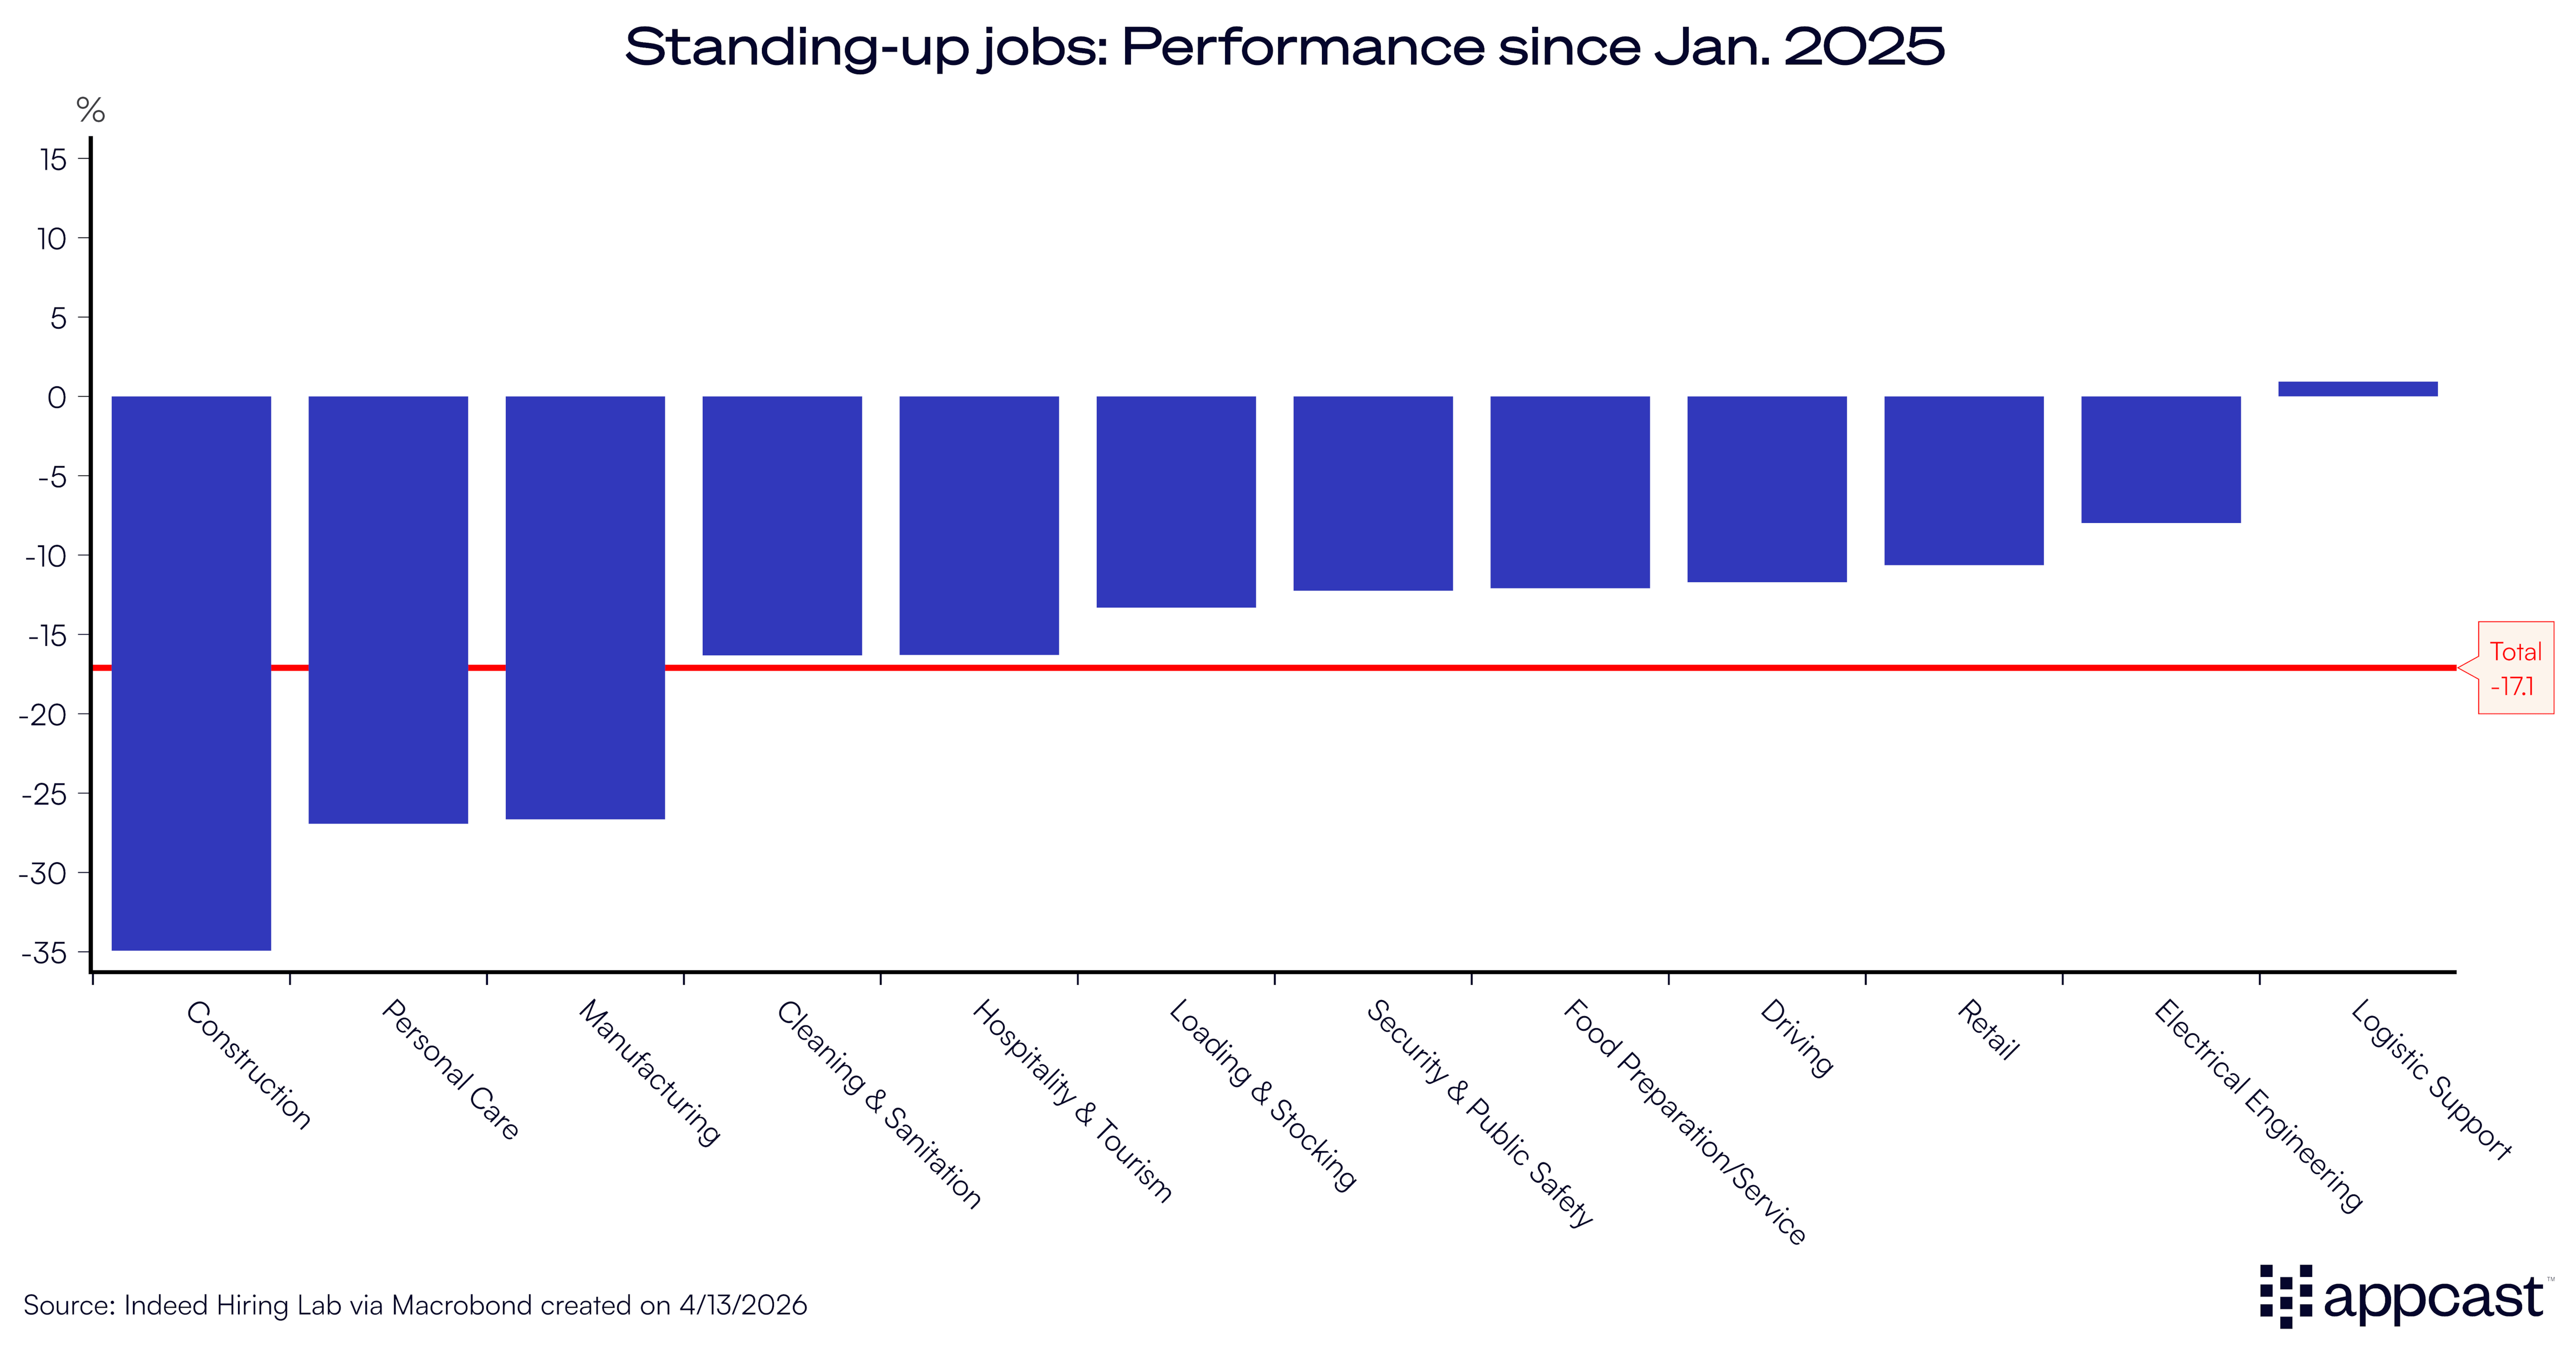
As we usually see with our data, hiring demand varies considerably across occupations. White-collar job postings have declined faster than standing-up roles. Both white-collar and standing-up roles have been affected by the current economy, but the impact differs widely by industry.
Even with wider economic patterns, the type of role still plays a big part in hiring costs and apply rates. White-collar positions, especially in specialized technical fields, remain more expensive to fill due to strong competition for skilled workers and longer hiring processes.
New data also shows that candidates are adjusting to changes in the job market. With more layoffs and slower hiring, apply rates for gig roles have increased and are now higher than those for sitting down roles. White-collar positions remain some of the most expensive to hire for, especially in technology, science, and engineering.
Geographic Insights
Apply rates and hiring costs also differ by geographic area. London benefits from a large and active pool of candidates, which leads to higher apply rates and lower recruitment costs.
On the other hand, Northern Ireland continues to have the lowest apply rate in the UK. When apply rates are lower, employers need to spend more to attract qualified candidates. As a result, Northern Ireland has a higher cost- per- application than other regions.
Best Practices in Job Ad Content
As a TA leader, there are still ways that you can impact your recruiting costs and apply rates. The way you time, write, and structure your job ads can directly affect results. Here are a few things you should consider:
- Post jobs on Monday or Tuesday, when job seekers are most active
- Keep job titles between seven and nine words
- Choose punctuation carefully. Exclamation marks add enthusiasm, while colons can make titles too long
- Keep the application process under five minutes, as longer applications lead to fewer people applying
Understanding these patterns can help recruiters make more informed decisions. The 2026 UK Recruitment Marketing Benchmark Report expands these findings with a deeper view into recruitment performance across the UK. Download the report today to learn more.